Using Estimated Profit Margins with the Rule of 40
In June of 2024, I wrote a post about using estimated revenue growth for calculating Rule of 40 and the Rule of X. Since then, an additional option has been added: Future Profit Margin based on future earnings estimates. Depending on how a company's fiscal year lines up, estimates for 2025 and 2026 may be available.
There are trade-offs when substituting Profit Margin for FCF Margin. The studies I refer to in other articles state that FCF Margin was superior to other margin calculations in predicting future returns1. Obviously, earnings are easier to manipulate than cash flows. Which makes them prone to being less accurate. Because earnings estimates are based on average projections from analysts, they are too optimistic (more often than not). And the further you go into the future, the less accurate they will be.
Given these shortcomings, why even bother with examining Rule of 40 values using anything other than FCF Margin? One reason is to check for consistency with a company's recent growth rate to the growth rate expected for the near future. Another is that it shows how drastically results can change. This can cause a complete shake-up in the Rule of 40 rankings.
The most important reason to look at future margins is to compare the current and recent past to the future. Often, the companies ranked highest show very rapid growth in the past year. And, sometimes, this occurs along with high FCF Margins. However, if this performance isn't expected to continue, the stock price will drop to a level that corresponds with Mr. Market's future expectations. Some of the highest ranked companies fall under this criteria: lower EV/Revenue (because of a recent drop in the stock price), high FCF Margin (due to recent performance) and high Revenue Growth (due to a high historic growth rate which may be slowing).
After applying trailing 12 months (TTM) data to get the top rankings, it's wise to check the future projected data for every company that may be of interest. The main objective is to derive what a future sustainable growth rate is. Great investments can be made when the general market believes a company's growth stage is over when, in fact, it is not. Part of this analysis should entail how big a company's moat is (or will become once it achieves scale). In situations like this, the company's stock would have experienced a large sell-off, resulting in it being undervalued.
Given the scenario just described, the next thing to address is: what stage of the corporate life cycle is the company in? And whether a company went (or is going) through a transition. Historically, a company may have had impressive revenue growth, well over 20% per year. However, given the news (and other research) along with future earnings projections, you suspect the company may be transitioning from one phase of the corporate lifecycle to another. In this example, this would mean the the company is starting to mature because it's going from a period of very rapid growth to a period of slower (but steadier) growth.
Company Transition
| Item | Past | Future |
|---|---|---|
| Phase | High Growth | Mature Growth |
| Revenue Growth | Very High | Moderate |
| FCF Margin | Low or Negative | Positive and Increasing |
| EV/Revenue | High | Moderate |
In the case where there is a transition to slower growth, notice above that it will come with a lower valuation multiple (EV/Revenue). This happens despite improving margins and greater profitability. Since investors are no longer willing to pay as high a price for a dollar of revenues, the stock generally sells off. (It would be entirely possible for a company to smoothly transition into a new phase by the stock price only moderating while revenues grow faster than the stock price appreciates. However, the most common scenario is that Mr. Market is almost never ready for the transition once it becomes evident, resulting in a large sell-off and a volatile period.)
In the situation just described, some of the best investments are made when the reaction to the transition goes too far, causing stock prices to plummet. It's not uncommon for a growth stock to go from being priced in bubble territory to being undervalued in a relatively short amount of time. Many great companies that successfully compounded capital had multiple sell-offs of over 50%. A reset in expectations when a company transitions from one stage of the corporate life cycle to another is a common reason why a great company can experience a number of crashes during it's long-term ascent.
Maturing companies often do make great long-term investments. The most important thing is to invest when the company is at or below fair value. Understanding the phases of the corporate lifecycle is important to understanding the proper range for a company's valuation. For a maturing company, the investor should require paying a lower EV/Revenue or lower Free Cash Flow yield.
Using the Rule of 40 Tool
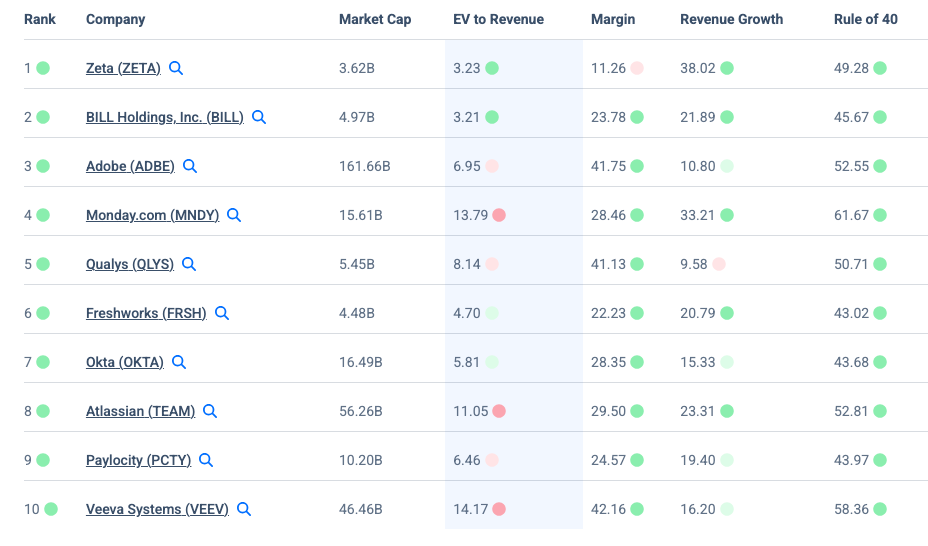
On our Rule of 40 page, the table loads using the trailing 12 months (TTM) data for Free Cash Flow Margin and Revenue Growth. This is good starting point for generating a list of companies that are worth researching further:
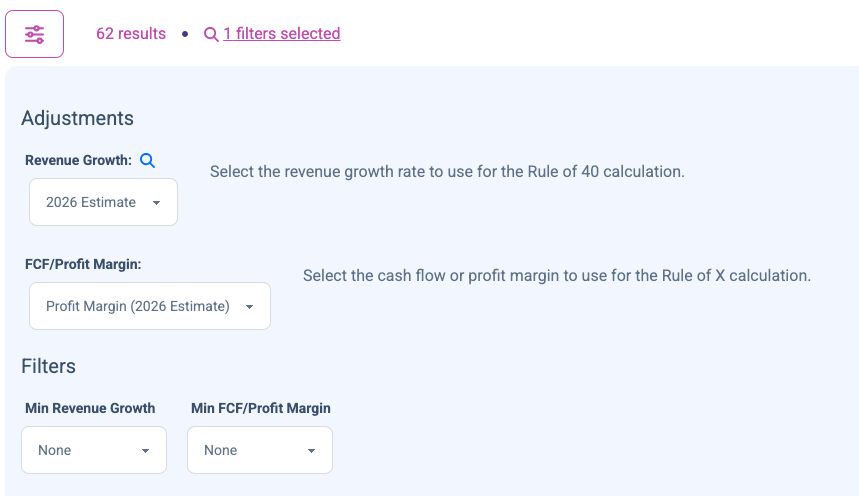
From here, we can adjust the parameters by clicking the adjustments icon just above the table. You should see adjustments for Revenue Growth and FCF/Profit Margin. As of this writing, you should see options for 2026 estimates for each:
After selecting the 2026 estimated data for each, a new table gets generated:
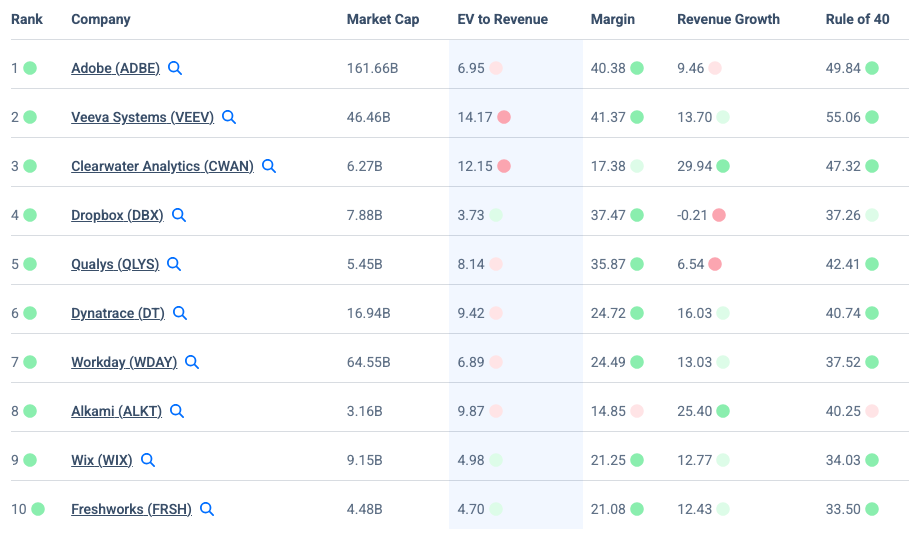
By switching from TTM data to data based on 2026 projections, the results can vary quite drastically. One thing to point out about these results is that Adobe jumps from being ranked #3 to #1. This is mostly due to it's massive profit margins. Generally speaking, Adobe is near the top of the search results because it's both performing well and the stock recently sold off, bringing down the valuation. The narrative in the investing world is that generative AI is a threat to it's business. Although this is a discussion for a different day, if the narrative is true, the sell-off is justified. If not, the stock is undervalued.
From here, we can further tweak the ranking parameters. One thing I typically like to do is require a Minimum Revenue Growth of 7%. This removes any companies that are not growing. However, this extra requirement may filter out good companies experiencing a temporary downturn in earnings growth.
Concluding Thoughts
The Rule of 40 and Rule of X pages are great tools for narrowing down a list of great growth stocks in the software/cloud computing industry. Between this tool and further research on specific companies, the goal is to reveal great stocks that are currently cheap (or at least fairly valued). The combined use of recent performance and future projections will help gauge where the company currently sits in the corporate lifecycle and how it's expected to perform in the future.